
NHL News
Matt Perri explains his Cap Relief Value model
Matt Perri, former Director of Analytics for the Arizona Coyotes, shares his methodology for the Cap Relief Model. This model is the basis for the PuckPedia Perri Cap Relief Calculator, check it out!
If you missed it, check out Matt's article sharing his experience creating the Draft Pick Value Table.

Market Value
Part II: Cap Relief Value
What is $1M in cap relief worth?
In my previous article, I wrote about draft pick market value models and how they are used in the NHL. I’m going to apply the pick value chart from that article to help build a new model that extracts the market value of cap relief (measured in draft picks) from historical trades involving cap relief. The goal is not to say what $1M in cap relief should fetch, but what it has fetched.
Three Team Retention Trades
The easiest way to determine the value of cap relief is to analyze trades that involve a third team acting as a middle-man. The middle-man in these trades receives draft picks in exchange for taking on dead-cap, so we get clean examples of cap relief traded for draft capital. To make the modeling as simple as possible, I am only analyzing three team retention trades involving one player (not counting prospect signing rights which are often exchanged in these deals but don’t really mean much).
After filtering through PuckPedia’s trade database, this is what I was left with:
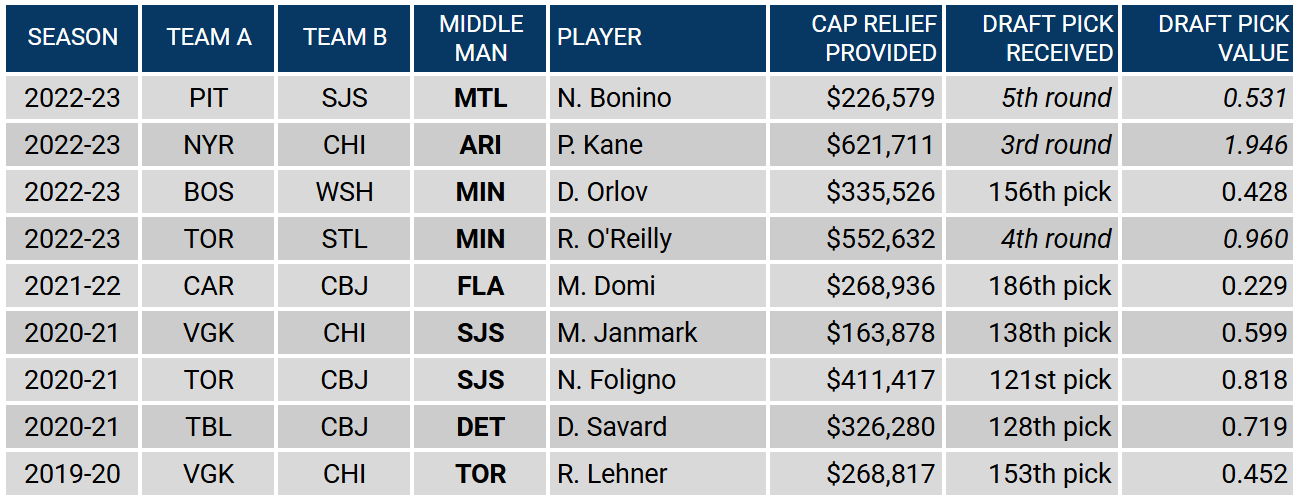
Please note the following:
- These are all in-season trades, so total cap relief provided shows the remaining cap hit after calculating the remaining days in the current season. For example, if a trade is made with 50% of the season remaining and a player’s cap hit is $2M with 50% retained, the total cap relief provided would be $500K (0.5 * 2,000,000 * 0.5). If that player has another year on their contract, then the total cap relief provided would be $1.5M ((0.5 * 2,000,000 * 0.5) + (0.5 * 2,000,000)).
- Picks that were unknown at the time of trade are assigned the pick number that they became. This approach is worthy of debate, but I think it’s better than taking the average or median value per round because teams can reasonably project the final pick order by the trade deadline, at least within that season.
- Picks that are still unknown as of publication of this article (in italic) are assigned the median pick value per round.
If we add a “zero” point (assume an observation where zero dollars of cap relief is worth zero draft pick capital), plot these trades and fit a trendline, we get the following chart, with cap relief on the vertical axis and pick value on the horizontal axis:
I think this curve is good enough for evaluating rounds 3 to 7, but we don’t actually have any three team retention trades involving picks in the first two rounds to learn from. To understand the value exchange involved with higher amounts of cap relief, we can look at other trades, specifically, cap dump trades.
Cap Dump Trades
To know how much cap relief may have been provided in cap dump trades, we need to know how much the player is actually worth. Since I want to minimize subjective analysis, I only included trades that fit the following criteria:
- No more than one player was traded. Again, non-NHL contracts or signing rights are ignored if I think they aren’t crucial for the trade.
- The reliever acquired at least one draft pick (since we are trying to measure cap relief in draft pick value).
- The relieved acquired either 1) future considerations, and/or 2) draft picks (so long as they traded away more draft capital than they received).
- Trades that otherwise fit the criteria are omitted if it seemed to me that the reliever needed the bad contract for LTIR purposes or to get to the cap floor (for example, Shea Weber, Ben Bishop, etc). This is another kind of trade.
For the player evaluation that was necessary, I used an extremely simple model based on P/GP and TOI/GP for skaters (with forwards and defense treated separately), and GP/maxGP for goalies. A better player evaluation model that incorporates advanced player metrics and applies age curves for future years would theoretically improve the overall cap relief model, but I’ll leave that for another iteration. See the appendix at the bottom for a more detailed explanation. The important takeaway is that this model produces an xCap metric for players — an expected cap hit that we can compare to their actual cap hit.
The player model I chose produced a few anomalies I had to address. I wanted to avoid arbitrary evaluation, but take the Shayne Gostisbehere trade for example. Based on his P/GP and TOI/GP from the previous season, my simple player evaluation model says he was worth 90% of his $4,5M cap hit. It doesn’t make sense that Philly would want to pay to dump him if they agreed with that evaluation, so I manually adjusted his worth to ½ of his cap hit (admittedly completely arbitrary — I could just as well have set his xCap to league minimum since Philly traded him and picks for nothing). I treated Will Butcher the same.
Here’s what we’re left with:
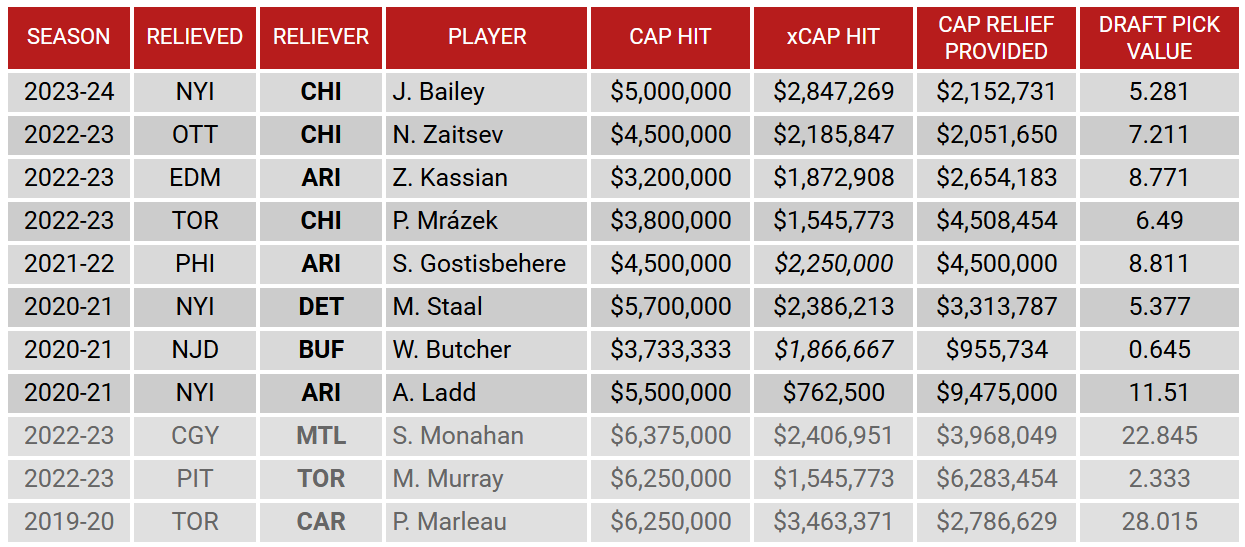
I’m applying the same cap calculations and pick value calculations that I used in the three team retention trade set. Also note the three trades below the dotted line (Sean Monahan, Matt Murray and Patrick Marleau). For reasons I will discuss later, I removed them from my dataset. For now, let’s plot the remaining cap dump trades together with the three team retention trades.
All Together Now
I was reasonably satisfied when I compared the two trend lines together (now plotted against pick number rather than pick value):
We still don’t really have observations for the first round, especially where most of the draft’s value lies (early), but the trend lines line up fairly well. I combined the two curves using a weighted scale, favoring the cap dump trendline for early picks and the three team retention trendline for later picks. That produced the following curve:
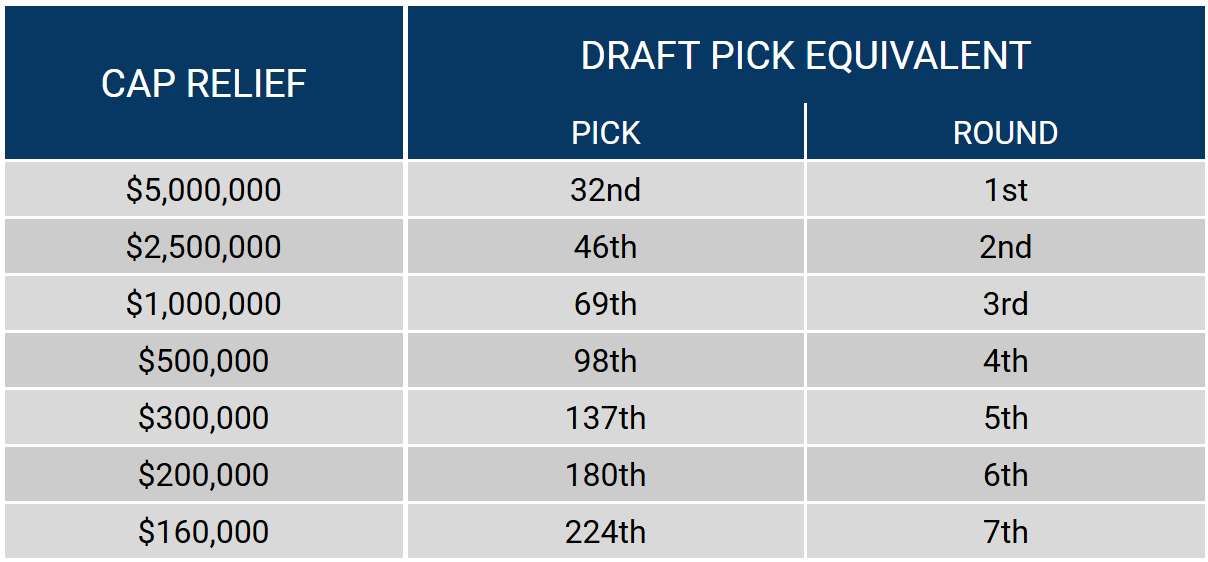
This is the basis of the model. Enter a cap relief total, and it will suggest a draft pick closest in value.
For instance, if you need a team to eat $1M in cap hit, either as a third team retainer or as part of a cap dump, the model suggests they should offer the 69th overall pick, a third round pick. Another possibility would be the 79th (3rd) and 130th (5th).
Here are some basic thresholds of cap relief and their draft pick equivalent:
CHECK OUT THE PUCKPEDIA PERRI SALARY CAP RELIEF CALCULATOR!
Considerations
This model is considerably less objective than the draft pick value model in my previous article. That one used entirely objective data, while this model involves multiple subjective steps to treat the data, as well as some other considerations.
Sample Size and Coverage Bias
Our sample size is low. Crucially, we have no data at all involving early first round picks, the area of the draft holding the most value. Put another way, we have no trades involving a lot of cap relief ($10M+, for example). As a result, the model's suggestions in this range should be taken with a grain of salt.
Market Seasonality
Two kinds of trades — three team retention and cap dumps — were combined together in the model, but these types of trades tend to occur at different times in the season cycle with different market pressures at play.
Outliers
A few outliers can sway the model significantly. For example, Patrick Marleau’s 2019 trade from Toronto to Carolina represents 10.0 draft pick points per $1M of cap relief, while the average for the data points included in the model was about 2.5 draft pick points per $1M of cap relief. This was the first trade in the overall data I looked at, so I excluded it on the basis that the market was too volatile at the time.
Cap vs Salary and Buyouts
Carolina’s subsequent buyout of Marleau did not result in any change to the cap hit, but it did save them a bit of cash. Some cases in the dataset involved buyouts affecting cap hits as well as salaries (Josh Bailey and Zack Kassian), but they were minor amounts. I’m sure the teams knew the post-buyout math as they negotiated the deals, but whether or not those figures were actually part of the negotiations is uncertain.
My attempt at a salary relief model was much less successful than my cap relief effort. I think this is a reflection of the fact that cap hits always matter in a trade, while salaries sometimes matter. Some of the trades in the dataset seem to make more sense when salary is modeled instead of cap hit. In particular, the deadline three team retention trades offer a somewhat clear picture of salary relief value. Overall though, the results were weak.
The problem is that the overall salary owed ratio (salary owed / cap hit owed) of the traded contracts in our dataset determines how much salary relief is worth relative to cap hit relief, and our data set is too small of a sample to deal with the high variance in salary owed ratio.
I’m not sure if I can explain this briefly, so for the moment, I’m only modeling pre-buyout cap hit relief. I will be back with an attempt to explain salary relief and consider buyouts.
Miscellaneous Subjectivity
Other factors can sway the model significantly. For example, Sean Monhan’s 2022 trade from Calgary to Montreal involves a still unknown 1st round pick. The complicated set of conditions means the value of the trade could swing wildly depending on what happens to occur. This was enough for me to exclude it from the dataset.
Matt Murray’s trade was excluded simply because I cannot explain how that much cap relief brought in only 3rd and 7th round picks.
In Real Life
So how does a chart like this actually get used by NHL Hockey Ops? Well, the deadline is around the corner but teams started their work months ago.
At some point early in the season, the “middle men” teams floated the idea to other teams that they would be able to eat cap at the deadline as a third team retainer. Knowing who can eat cap upfront allows the main two teams in a potential deal to negotiate the basics before confronting the retention aspect.
After that, teams do their thing researching comps to establish a draft capital equivalent for the amount of cap relief involved in their potential trades. To the teams that use them, a value chart like the one in this article provides a thorough sense of aggregate costs quickly, giving deadline buyers an overview of how much draft capital is required to make a third team want to retain, and giving sellers a projection of what the pick haul could be given an amount of cap space to weaponize.
We’ll test how well our cap relief model works as this year’s deadline deals start rolling in. Until then.
Thanks to PuckPedia for letting me use their data and making this possible.
Player Evaluation Appendix
To evaluate the players involved in cap dump trades, I created a simple xCap metric by regressing a few stats against cap hit. The regressions for forwards and defense look like this:
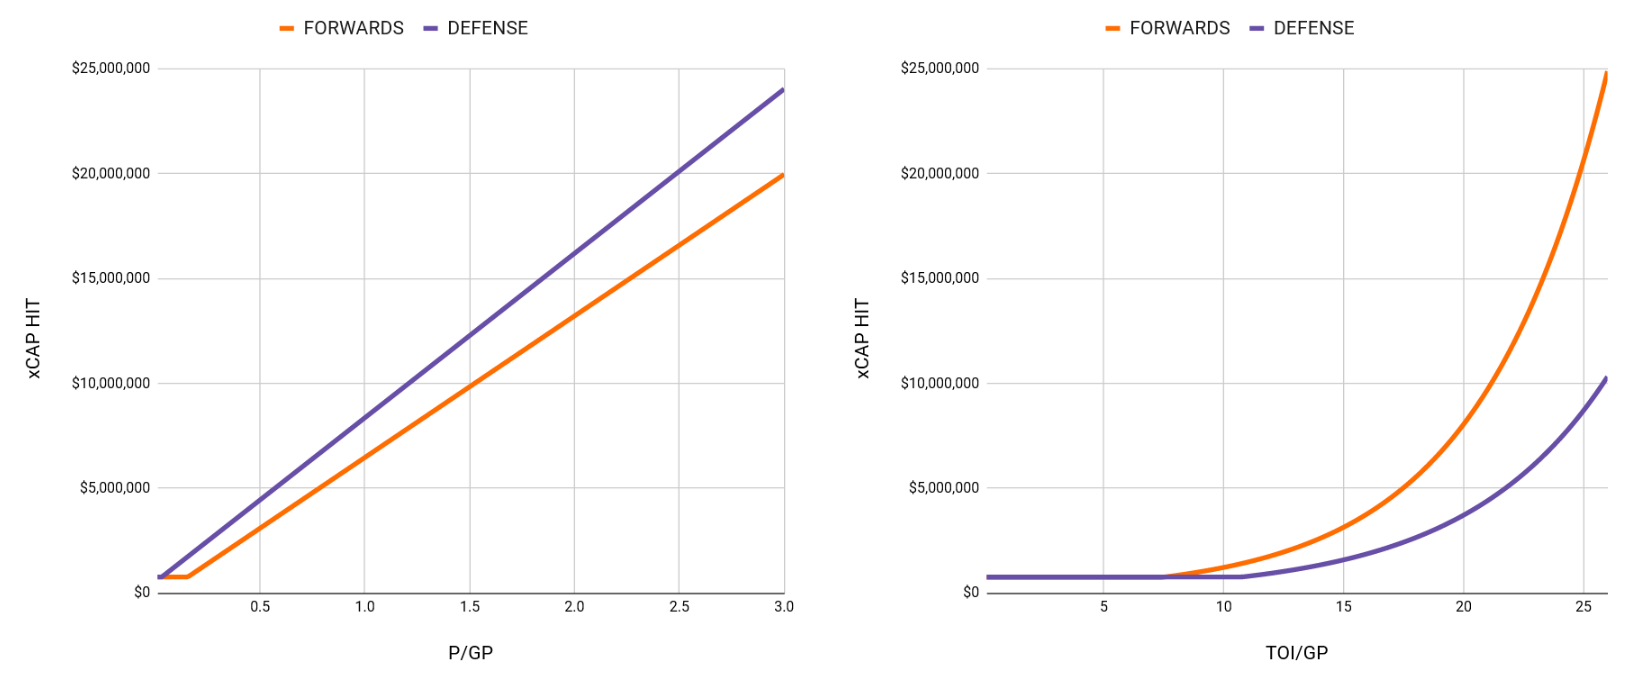
I averaged the outputs of each regression together. For example, a forward with 0.50 P/GP and 16:00 TOI/GP is worth $3.1M in the P/GP regression and $3.8M in the TOI/GP regression. I take the average ($3.45M) as the player’s xCap.
For goalies, the regression looked like this:
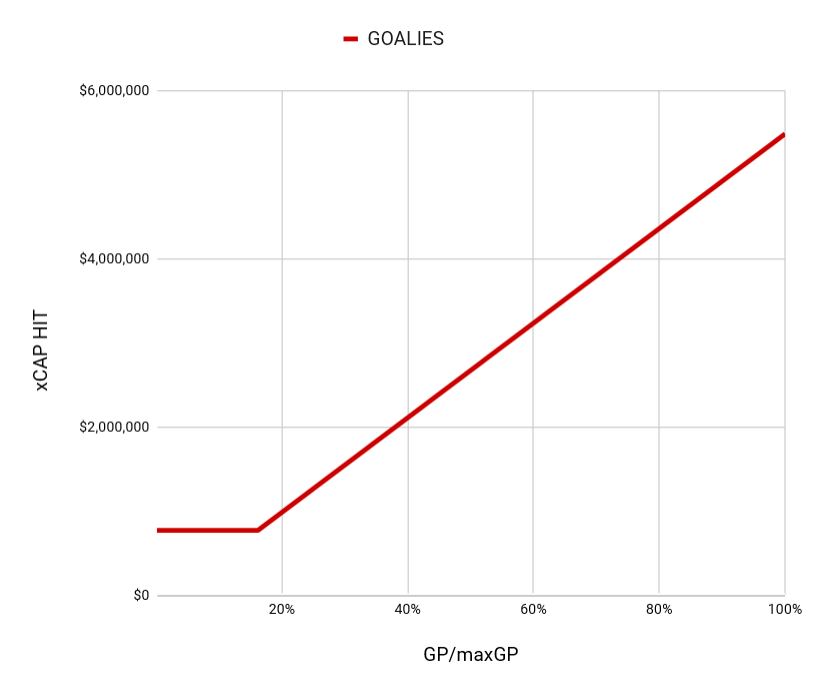
Note that GP/maxGP is games played / the most games played by a goalie that season. This stat is more predictive than save % or GAA, though much less predictive than either P/GP or TOI/GP are for skaters. Modeling goalie cap hits is difficult however you try to do it, and one of the conclusions we have to reach is that NHL teams have not figured out how to pay for the wild variance in season-to-season goalie performance.
Anyways, that’s pretty much it for the model. Nothing fancy, but it does the trick.
Here are some examples to consider:
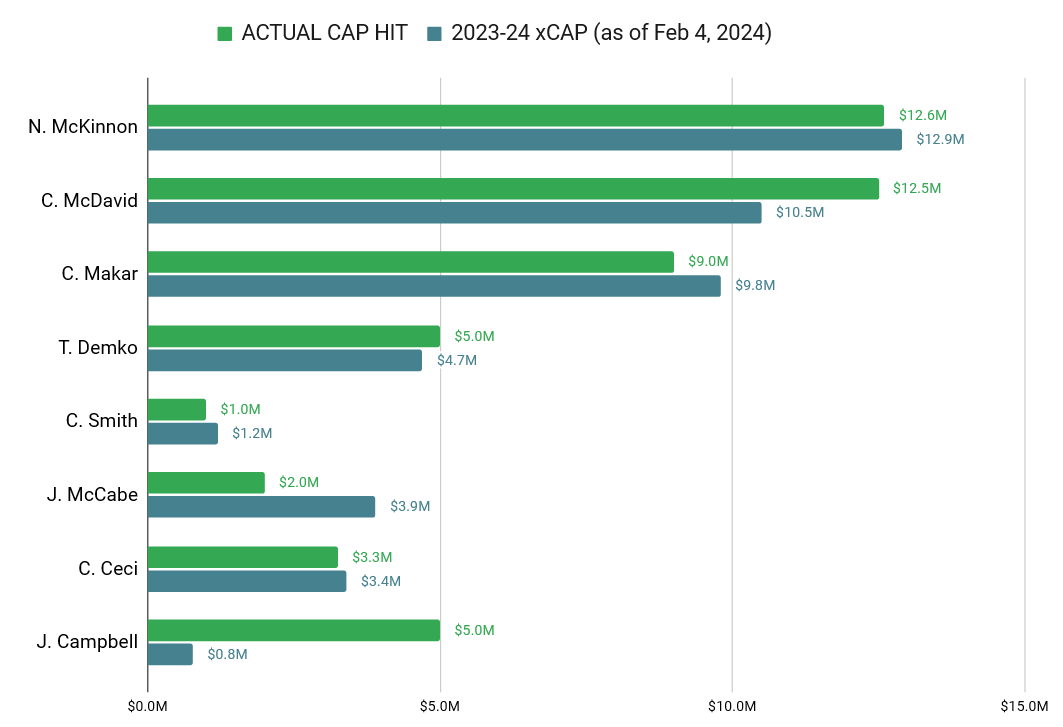
I looked at many others and I think most of the differences are mostly explained by actual value above/below the player’s cap hit. Goalies were the biggest outliers, unsurprisingly.
Overall, this model does the trick well enough for what we need it for.